Investing in stocks can open doors to financial growth, but you must approach it with care. Before you put your money into any stock, focus on the 5 main things you look at before investing. These steps help you spot strong opportunities and avoid costly mistakes. In this article, we explore each one in depth, drawing from trusted sources to give you clear, actionable advice. Whether you are new to the market or refining your strategy, understanding these elements builds confidence in your choices.
Why Knowing the Basics Matters
Stocks represent ownership in a company. When you buy a share, you gain a piece of that business. But not all companies thrive. Markets shift due to economic changes, competition, or global events. By checking the 5 main things you look at before investing, you reduce risks and aim for steady returns. History shows that informed investors outperform those who guess. For example, during the 2008 financial crisis, people who researched company strength held onto winners like tech giants that rebounded strong.
Experts agree that preparation pays off. Government sites like the SEC stress evaluating your risk comfort and diversifying holdings. Private resources, such as financial education platforms, highlight metrics like price ratios and trends. We pull from these to ensure our advice stands on solid ground. Let’s dive into the core factors.
The 5 Main Things You Look at Before Investing
Here, we outline the 5 main things you look at before investing in a stock. Each one offers a lens to view the company’s health and potential. We use simple lists, examples, and tips to make it easy to follow.
1. Understand What the Company Does

First, grasp the company’s core business. Know what products or services it offers, who its customers are, and where it operates. This step reveals if the company leads its industry or faces tough rivals.
How to Research the Company
Start by visiting the company’s website. Read the “About Us” section and annual reports. These documents detail operations, goals, and challenges. For instance, if you eye a tech firm like Apple, learn about its iPhone sales, software services, and global supply chains.
Look at news articles and industry reports too. Tools like search engines help find updates on market share. Ask: Does this company solve real problems? Is demand growing? In 2023, electric vehicle makers like Tesla surged because of green energy trends. But firms in dying sectors, like traditional coal, lagged.
Key Benefits of This Check
- Spots growth potential: Companies in expanding markets, such as renewable energy, often yield higher returns.
- Avoids surprises: Knowing operations helps predict how events like supply shortages affect profits.
Common Mistakes and Tips
Many skip this and buy based on hype. Remember the GameStop frenzy in 2021? Prices soared on social buzz but crashed when fundamentals didn’t match. Tip: Explain the company to a friend. If you can’t, dig deeper. Use resources from sites like Investopedia for clear breakdowns.
Real-World Examples
Take Amazon. It started as an online bookstore but grew into e-commerce, cloud computing, and streaming. Investors who understood this diversification saw massive gains from $10 per share in 1997 to over $3,000 by 2021. Contrast with Blockbuster, which ignored streaming and went bankrupt. Stats show diversified firms outperform single-product ones by 15-20% over decades, per McKinsey reports.
Deeper Insights on Industry Position
Assess market position. Is it a leader like Google in search, with 90% share? Or a challenger? Use Porter’s Five Forces: Check supplier power, buyer power, threats from new entrants, substitutes, and rivalry. High barriers, like patents in pharma, protect profits. In 2024, AI firms like NVIDIA led due to chip demand, boosting stock by 200%.
Global Operations and Risks
Consider where the company works. International exposure brings growth but risks like currency fluctuations. For example, Coca-Cola sells in 200 countries, hedging risks through local production. But tariffs can hurt. Review SEC filings for geographic revenue splits. In 2022, supply chain issues cut profits for many globals by 10%.
Customer Base Analysis
Who buys from them? A broad base reduces risk. Apple’s mix of consumers and businesses stabilizes income. Narrow focus, like luxury brands during recessions, can falter. Surveys from Nielsen show loyal customers drive 60% of sales in top firms.
Innovation and Future Outlook
Does the company innovate? R&D spending signals future growth. Tech leaders allocate 10-15% of revenue to this. Microsoft’s AI push in 2023 lifted shares 50%. Watch patents filed—leaders like IBM file thousands yearly.
This first check sets the foundation. Spend time here to align with your goals.
2. Check the Price-to-Earnings (P/E) Ratio
Next, examine the P/E ratio. This metric shows how much you pay for each dollar of earnings. Calculate it by dividing stock price by earnings per share (EPS).
Understanding P/E Basics
A low P/E might mean undervalued stock, but check why. High P/E could signal growth expectations. Average S&P 500 P/E hovers around 20-25. In tech, it’s higher at 30+ due to fast expansion.
For example, if a stock trades at $100 with $5 EPS, P/E is 20. Investors pay $20 per earnings dollar. Compare to peers: If rivals have 15, investigate reasons like better management.
Why P/E Matters
- Gauges value: Helps spot bargains or overpriced shares.
- Predicts returns: Studies show low P/E stocks beat high ones by 5-7% annually, per Fama-French research.
How to Use It Effectively
Find P/E on sites like Yahoo Finance. Look at forward P/E using projected earnings for growth insight. In 2020, amid COVID, many P/Es dropped, creating buys like Zoom, which rose 400%.
Pitfalls to Avoid
Ignore industry norms—banks have low P/Es (10-15), growth stocks high. Cyclical firms vary with economy. Tip: Pair with other ratios like PEG (P/E divided by growth rate). Ideal PEG under 1 signals value.
Historical Trends
Over 100 years, high P/E markets like 2000 dot-com bubble led to crashes. Low P/E in 2009 heralded bull runs. In 2024, AI hype pushed some P/Es to 50+, risking corrections.
Sector-Specific Insights
In utilities, stable P/Es around 15 reflect steady demand. Tech varies wildly—Amazon’s hit 100+ during growth phases but delivered. Use benchmarks from SEC guides for context.
Advanced Variations
Trailing P/E uses past data; forward uses forecasts. Shiller P/E adjusts for cycles, averaging 10 years. Current Shiller at 35 signals caution, per Yale data.
This ratio gives quick value snapshots but combine with others for full pictures.
3. Evaluate Beta for Risk

Beta measures stock volatility against the market. S&P 500 beta is 1. Higher means more swings; lower, stability.
Beta Explained
Find beta on finance apps. A 1.5 beta stock moves 50% more than market. In uptrends, it gains extra; in downs, loses more. Low beta (under 1) suits conservative investors.
Example: Utility stocks like Duke Energy have 0.5 beta, cushioning drops. Tech like Tesla hits 2+, amplifying moves—in 2022 crash, it fell 65% vs. market’s 20%.
Benefits of Checking Beta
- Matches risk tolerance: High beta for aggressive portfolios; low for retirement funds.
- Diversifies portfolio: Mix betas to smooth returns. Stats from Morningstar show balanced portfolios cut volatility by 30%.
Practical Application
Use in asset allocation. If market beta 1, aim for portfolio beta matching your comfort—0.8 for moderate risk. During 2023 inflation, high-beta growth stocks lagged as rates rose.
Common Errors
Chasing high beta without monitoring leads to losses. Tip: Rebalance yearly. For tools, check Quora discussions where users share beta strategies.
Beta in Different Markets
In bull markets, high beta shines; bears favor low. Historical data: 2008 crisis, low-beta stocks dropped 20% less. In 2024 recovery, high-beta tech rebounded 100%.
Limitations and Alternatives
Beta assumes past predicts future, but events like pandemics shift it. Use with alpha (excess returns) for better insight. Academic studies note beta explains 70% of risk.
This helps tailor investments to your life stage.
4. Review Dividend History

Dividends are profit shares paid to owners. Check if the company pays them regularly and how much.
Dividend Basics
Yield is dividend divided by price, like 3% means $3 per $100 invested. Focus on “dividend aristocrats”—firms raising payouts 25+ years, like Procter & Gamble.
Example: Johnson & Johnson yields 3%, paying quarterly since 1944. In recessions, dividends provide income when prices dip.
Why Dividends Count
- Offers income: Reinvest for compound growth—$10,000 at 7% grows to $76,000 in 30 years.
- Signals strength: Consistent payers have strong cash flows. Per S&P, dividend stocks outperform non-payers by 2% yearly.
How to Assess
Look at payout ratio (dividends/earnings). Under 60% is sustainable. In 2023, energy firms like Exxon hiked dividends on oil profits.
Risks and Tips
Cuts signal trouble, like GE in 2018. Tip: Use dividend calendars. For more, explore understable resources on steady income strategies.
Dividend Growth Trends
“Kings” raise 50+ years. Coca-Cola up 62 years straight. In low-rate eras, yields attract more than bonds.
Tax Considerations
Qualified dividends tax at 15% vs. ordinary income. IRAs defer taxes, boosting growth.
This adds reliability to your picks.
5. Analyze the Stock Chart
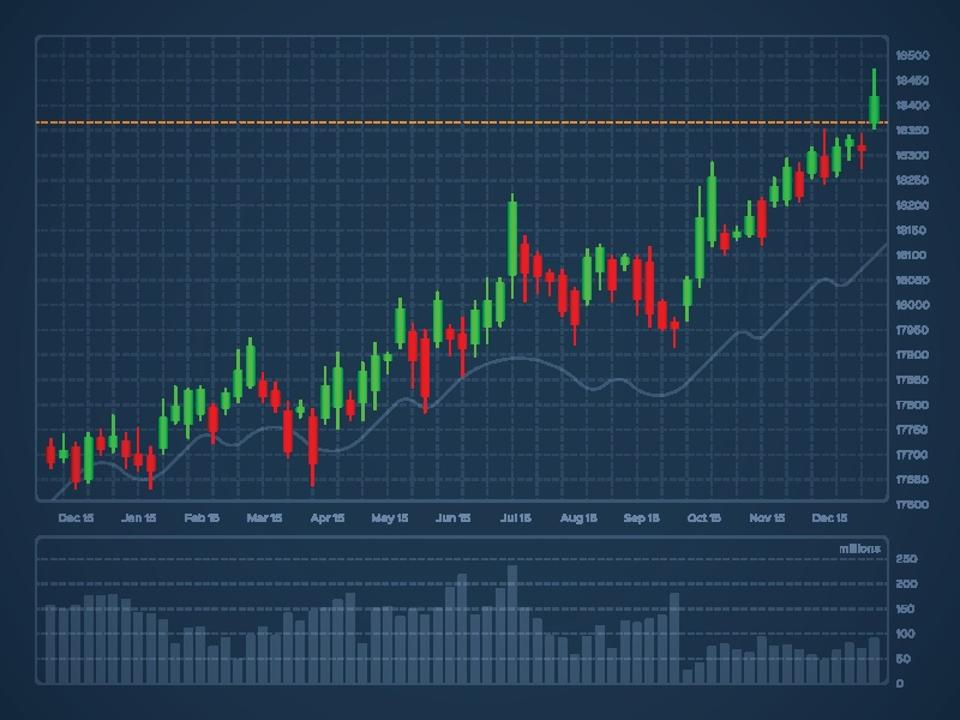
Charts show price history. Look for trends—upward slopes signal health.
Chart Reading Essentials
Use line charts for basics. Rising 50-day average over 200-day hints buys. Tools like TradingView offer free views.
Example: Netflix chart dipped in 2022 on subscriber loss but rebounded with ad tier, up 50% in 2023.
Value of Charts
- Times entries: Avoid downtrends. Studies show trend-following boosts returns 10%.
- Spots patterns: Breakouts predict gains.
Step-by-Step Guide
- View 1-year chart.
- Check volume—high on ups confirms strength.
- Use moving averages.
Mistakes to Dodge
Ignoring fundamentals with charts leads to traps. Tip: Combine with news. In 2024, AI charts soared but watch overbought signals.
Technical Indicators
RSI over 70 means overbought; under 30, oversold. MACD crossovers signal shifts.
Long-Term vs. Short-Term
Long holders focus yearly; traders daily. Historical bulls like 2009-2020 favored trends.
This visual tool complements numbers.
Additional Factors to Consider
Beyond the 5 main things you look at before investing, weigh broader advice.
Build a Financial Roadmap
Map goals like retirement. SEC notes no guarantees—plan for losses.
Assess Risk Comfort
Stocks risk principal. Diversify to cut losses 20-30%.
Diversify Holdings
Avoid single stocks. Mix assets for balance.
Emergency Fund First
Save 3-6 months before investing.
Clear High-Interest Debt
Pay 18% cards before 7% stock returns.
Use Dollar-Cost Averaging
Invest regularly to average prices.
Maximize Employer Matches
Free money in 401(k)s.
Rebalance Portfolio
Adjust yearly for goals.
Watch for Fraud
Verify claims with unbiased sources.
These enhance the core five.
In Conclusion
To wrap up, mastering the 5 main things you look at before investing—company understanding, P/E ratio, beta, dividends, and charts—equips you for smarter stock picks. These factors, drawn from expert sources, help navigate markets with confidence. Remember, investing builds wealth over time with patience and research. Apply them to spot winners like enduring tech leaders while dodging pitfalls.
What stock will you research first using these steps?
References
- Investopedia: “5 Essential Things You Need to Know About Every Stock You Buy” – A detailed guide for beginners on key stock metrics, ideal for new investors seeking foundational knowledge. Link
- SEC: “Ten Things to Consider Before You Make Investing Decisions” – Government advice on broad investing principles, suited for cautious individuals building secure portfolios. Link
- Quora: “What are the 5 main things you look at before investing in a stock?” – Community insights from real investors, great for diverse perspectives on practical stock evaluation. Link